Books That Shaped My Statistical Thinking
Written by Adam Green.
Much of my understanding of statistics has come from textbooks - I've also learnt a lot from popular statistics books aimed at a more general audience.
This post is a collection of insights from popular statistics books I've enjoyed over the years.
A few common themes in the excerpts below:
- more data is not always better,
- data and statistical models are limited,
- probability and statistics are about making decisions,
- statistics is hard and easy to get wrong.
Weapons of Math Destruction
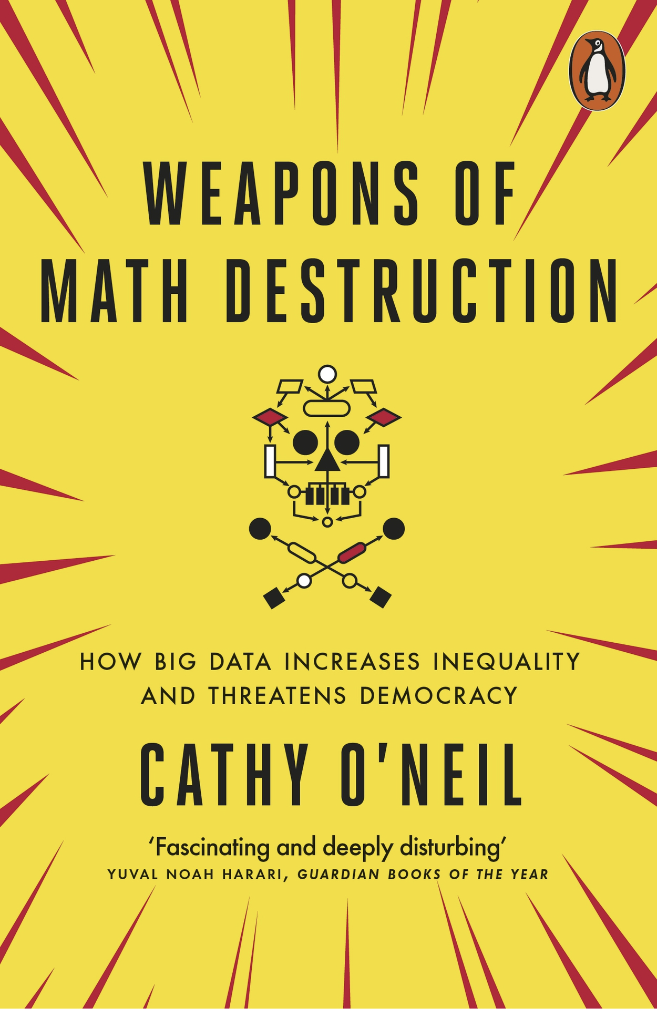
Tools Are What You Make Of Them
Predictive models are a source of bias, unfairness, and discrimination:
They’re opaque, unquestioned, and unaccountable, and they operate at a scale to sort, target, or “optimize” millions of people.
The ability of predictive modelling to scale (and then scale faster with feedback loops), along with a lack of proper oversight and regulation, is a real concern for society.
The Limits of Predictive Modelling
While data might feel impersonal, the data we collect and how we use it is the result of choices made by individual people.
The bias of predictive models comes both from data and decisions made by the statistical modeller:
Our own values and desires influence our choices, from the data we choose to collect to the questions we ask.
Models are opinions embedded in mathematics.
Even a process that collects data and does statistical modelling in an unbiased way, models can never capture the total complexity of the real world:
No model can include all of the real world’s complexity or the nuance of human communication.
Inevitably, some important information gets left out.
Data Flywheels
Feedback loops occur when predictions made by a model influence the data used to validate and train future models:
This creates a pernicious feedback loop. The policing itself spawns new data, which justifies more policing.
Like predictive modelling itself, feedback loops can be positive or negative.
The Signal and the Noise
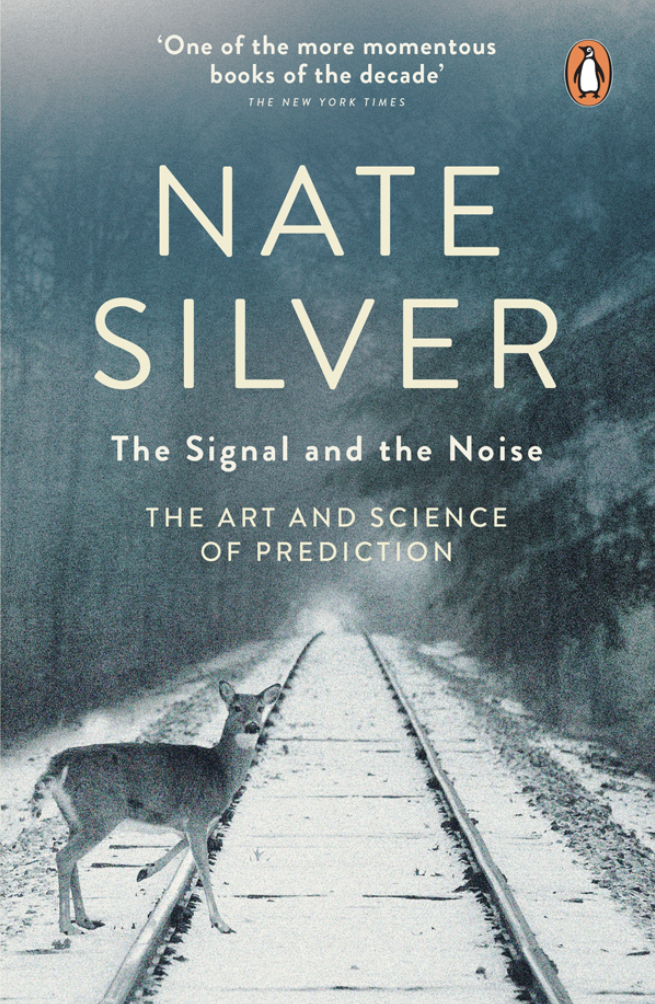
Bias, Variance and Capacity
Signal is truth; noise is distraction:
The goal of any predictive model is to capture as much signal as possible and as little noise as possible.
The balance between signal and noise creates the balance between bias, variance and model capacity in predictive modelling.
A high capacity model is a complicated model, which will overfit to the training data - creating a high variance, low bias model:
Needlessly complicated models may fit the noise in a problem rather than the signal, doing a poor job of replicating its underlying structure and causing predictions to be worse.
The inverse is a low capacity model that is too simple to capture the signal - creating a high bias, low variance model.
Model bias is reduced through diversity. Different models capture different parts of the signal. This is the wisdom of the crowd, where the average of many models is more accurate than any one model:
It’s critical to have a diversity of models.
Bias can also be reduced through data diversity. Unlike with variance, where more data helps to separate the noise and the signal, more biased data only leads to more biased data and models.
Probability is about Decision-Making
The value of probabilistic thinking is to improve your own decision-making:
The virtue in thinking probabilistically is that you will force yourself to stop and smell the data—slow down, and consider the imperfections in your thinking.
Over time, you should find that this makes your decision-making better.
Naked Statistics
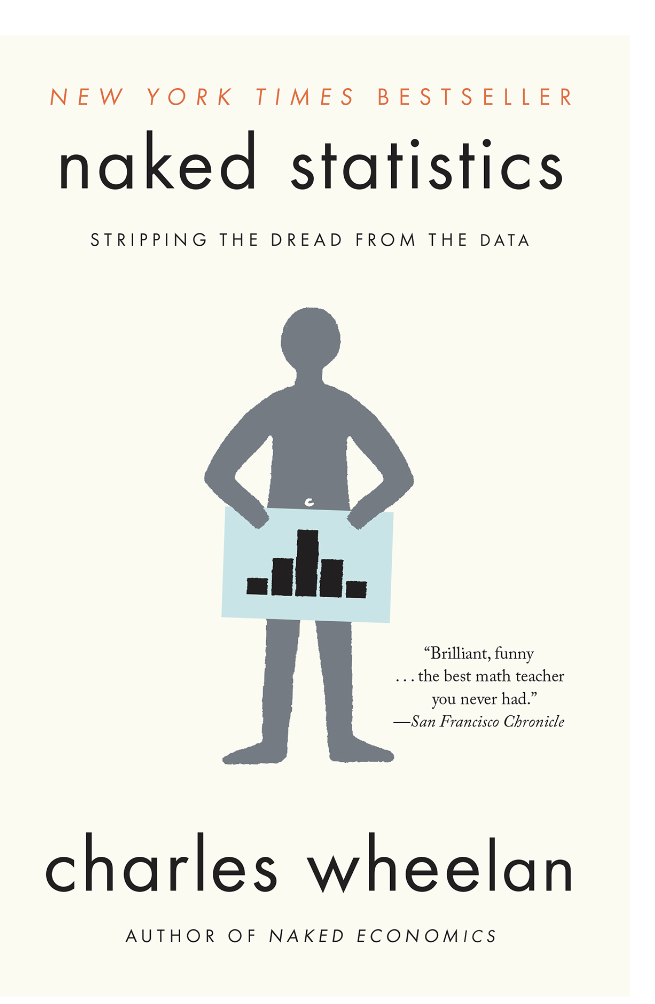
Statistics Simplifies the World
Descriptive statistics exist to simplify, which always implies some loss of nuance or detail. Anyone working with numbers needs to recognize as much.
The value of simplification is that we can understand simple. If the world is simple we can make decisions about it.
The cost of simplification is a loss of detail - any data, statistic or model loses nuances of the real world.
Calling Bullshit
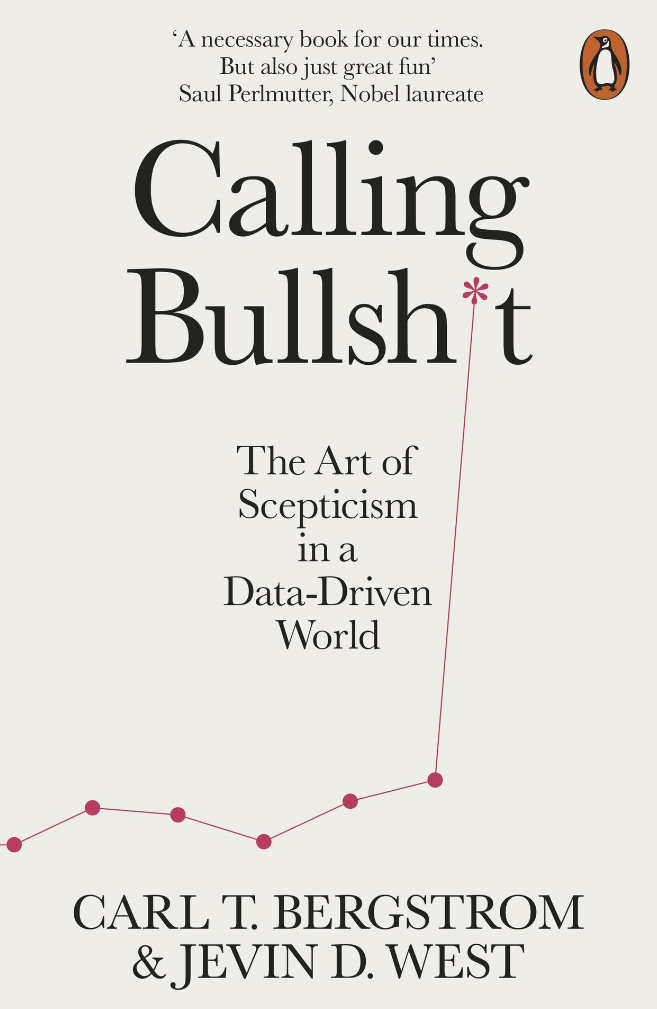
Brandolini’s principle
Part of the struggle of the rational, statistical person is Brandolini’s principle:
Perhaps the most important principle in bullshit studies is Brandolini’s principle.
Coined by Italian software engineer Alberto Brandolini in 2014, it states: “The amount of energy needed to refute bullshit is an order of magnitude bigger than that needed to produce it.”
It's harder to push back on noise than it is to create it.
Data Quality
Data quality is the most important factor in any analysis:
If the data that go into the analysis are flawed, the specific technical details of the analysis don’t matter.
Begin with bad data and labels, and you’ll get a bad program that makes bad predictions in return.
Types of Probability
There is a key distinction between a probabilistic cause (A increases the chance of B in a causal manner), a sufficient cause (if A happens, B always happens), and a necessary cause (unless A happens, B can’t happen).
There are (at least!) three useful types of probability:
- the marginal probability $P(A)$ of event $A$,
- the conditional probability $P(B|A)$ of event $B$ occurring given $A$ has occurred,
- the joint probability $(P(A,B)$ of $A$ and $B$ occurring together.
A probabilistic cause is when the conditional probability of $B$ given $A$ is greater than the marginal probability of $B$ - when $P(B|A) > P(B)$.
A sufficient cause is when the conditional probability of $B$ given $A$ is 1 - when $P(B|A) = 1$.
$A^c$ is the complement of $A$, where event $A$ does not occur. A necessary cause is when the conditional probability of $A^c$ given $B$ is 1 - when $P(B|A^c) = 0$.
Flaw of Averages
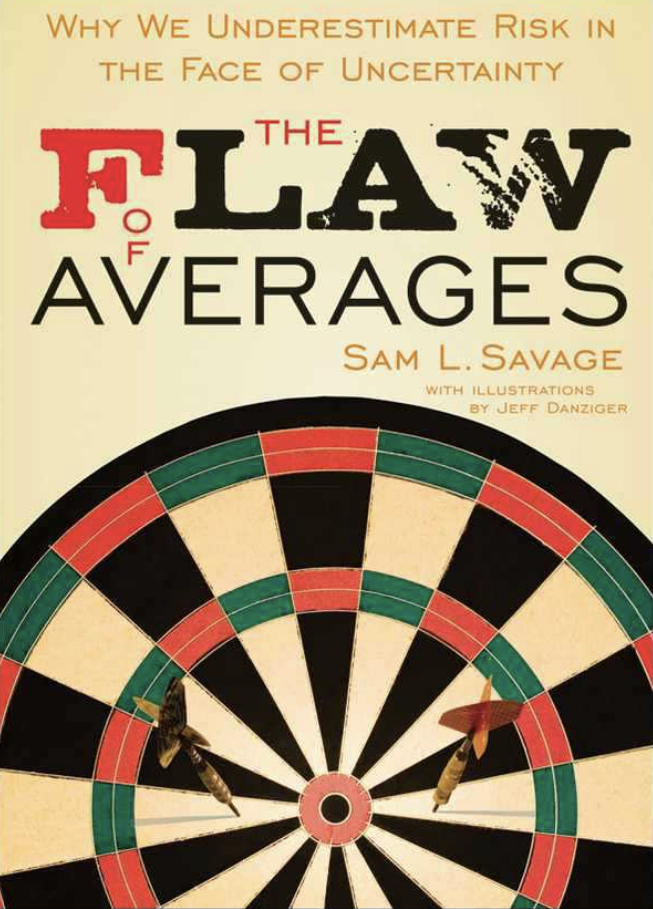
Average Abuse
The average is the most commonly used and abused statistic:
Plans based on average assumptions are wrong on average.
Abuse of the average can occur when the upside or downside either side of the average is not symmetric.
The example below demonstrates that when demand outstrips average supply, the business cannot capitalise on the opportunity:
To understand how pervasive the Flaw of Averages is, consider the hypothetical case of a marketing manager who has just been asked by his boss to forecast demand for a new-generation microchip.
“That’s difficult for a new product,” responds the manager, “but I’m confident that annual demand will be between 50,000 and 150,000 units.”
“Give me a number to take to my production people,” barks the boss.
“I can’t tell them to build a production line with a capacity between 50,000 and 150,000 units!” The phrase “Give me a number” is a dependable leading indicator of an encounter with the Flaw of Averages, but the marketing manager dutifully replies: “If you need a single number, I suggest you use the average of 100,000.”
The boss plugs the average demand, along with the cost of a 100,000-unit capacity production line, into a spreadsheet model of the business. The bottom line is a healthy $10 million, which he reports as the projected profit.
Assuming that demand is the only uncertainty and that 100,000 is the correct average (or expected) demand, then $10 million must be the average (or expected) profit. Right? Wrong! The Flaw of Averages ensures that on average, profit will be less than the profit associated with the average demand.
Why? If the actual demand is only 90,000, the boss won’t make the projection of $$10 million. If demand is 80,000, the results will be even worse. That’s the downside. On the other hand, what if demand is 110,000 or 120,000? Then you exceed your capacity and can still sell only 100,000 units. So profit is capped at $10 million.
There is no upside to balance the downside ... which helps explain why, on average, everything is below projection.
Statistics is about Decisions
Any piece of statistical work or data should always influence how a decision is made:
So what’s a fair price for a piece of information? Here’s a clue.
If it cannot impact a decision, it’s worthless.
Simpsons Paradox
Simpsons paradox is a phenomenon in statistics where a signal appears when data is aggregated, but disappears when the data is disaggregated.
Simpson’s Paradox occurs when the variables depend on hidden dimensions in the data.
The classic example of Simpsons paradox is a study on gender bias in university admissions. The hidden dimension is the department the students applied to.
Data aggregated across all departments showed a bias against women. Dissaggregated data showed that while four departments were biased against women, six were biased against men
The bias against women detected in the aggregated data occurred due to women being more likely to apply to more competitive departments.
Fooled by Randomness
Profiting off Variance
Nassim Nicholas Taleb is a trader - he makes his living by exploiting variance. Much of his perspective comes from experience of the role of variance in success:
Mild success can be explainable by skills and labor. Wild success is attributable to variance.
It's not just the probability of an event that matters, but the effect or magnitude of the event:
Accordingly, it is not how likely an event is to happen that matters, it is how much is made when it happens that should be the consideration.
The Danger of Data
While data driven decision making seems like a no drawback panacea, misused statistical thinking can lead to worse decisions:
A small knowledge of probability can lead to worse results than no knowledge at all.
The problem is that, without a proper method, empirical observations can lead you astray.
It is a mistake to use, as journalists and some economists do, statistics without logic, but the reverse does not hold: It is not a mistake to use logic without statistics.
Statistics requires both data and logical reasoning to be useful.
Statistics Done Wrong
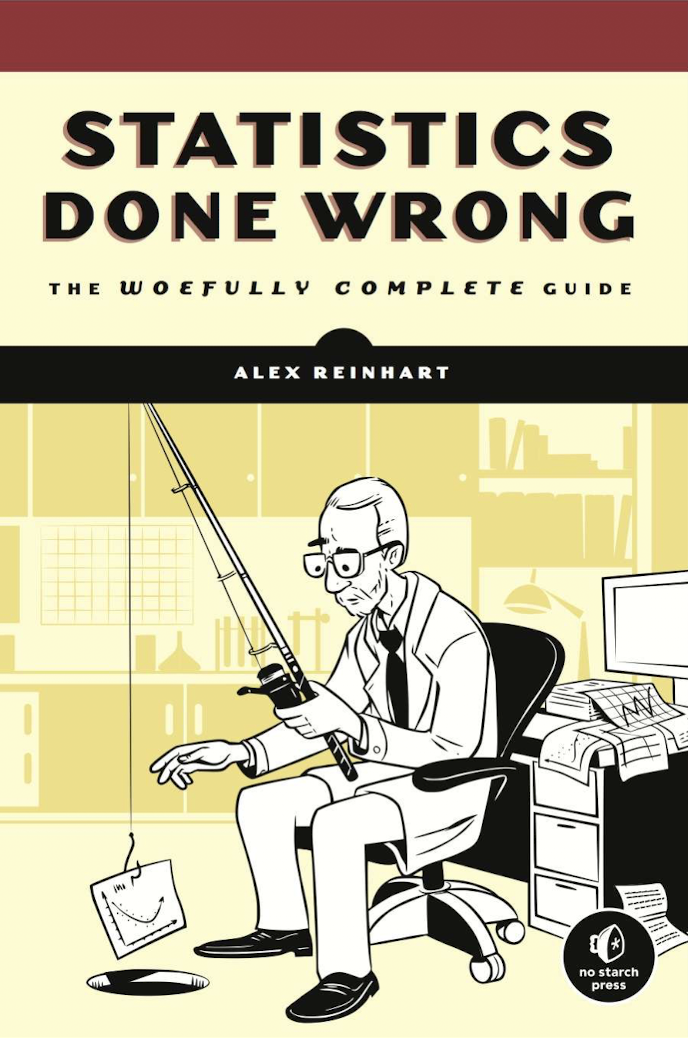
Statistics is Hard
Statistics is hard, and easy to get wrong:
Much of basic statistics is not intuitive (or, at least, not taught in an intuitive fashion), and the opportunity for misunderstanding and error is massive.
P-Value Problems
The p-value is a subtle concept. My go-to definition of a p-value is how likely is the dataset. If we assume that the true effect (also known as the null hypothesis) is zero, how surprised are we by our data?
Much of Statistics Done Wrong covers the problems that occur with calculating p-values in scientific papers:
Surveys of statistically significant results reported in medical and psychological trials suggest that many p-values are wrong and some statistically insignificant results are actually significant when computed correctly.
Even the prestigious journal Nature isn’t perfect, with roughly 38% of papers making typos and calculation errors in their p-values.
Other reviews find examples of misclassified data, erroneous duplication of data, inclusion of the wrong dataset entirely, and other mix-ups, all concealed by papers that did not describe their analysis in enough detail for the errors to be easily noticed.
Map and Territory
Biased Sampling
Data feels like one of those resources where more is better - in reality, more biased data can lead you down the wrong path faster:
When your method of learning about the world is biased, learning more may not help. Acquiring more data can even consistently worsen a biased prediction.
Cognitive versus Statistical Biases
Part of the problem we have with data come from our own biases and fallacies:
A cognitive bias is a systematic error in how we think, as opposed to a random error or one that’s merely caused by our ignorance.
Whereas statistical bias skews a sample so that it less closely resembles a larger population, cognitive biases skew our thinking so that it less accurately tracks the truth (or less reliably serves our other goals).
One systematic error is the proportion dominance effect:
A proposed health program to save the lives of Rwandan refugees garnered far higher support when it promised to save 4,500 lives in a camp of 11,000 refugees, rather than 4,500 in a camp of 250,000.
How Not to Be Wrong

Solve Easy Problems
A basic rule of mathematical life: if the universe hands you a hard problem, try to solve an easier one instead, and hope the simple version is close enough to the original problem that the universe doesn’t object.
Linearity
The concept of linearity can be illuminated from multiple angles. One of my favourite interpretations of linearity is to be on a journey:
Nonlinear thinking means which way you should go depends on where you already are.
Improbable Things Happen A Lot
A person can expect to experience events with odds of one in a million (referred to as a "miracle") at the rate of about one per month - this is Littlewood's law:
The universe is big, and if you’re sufficiently attuned to amazingly improbable occurrences, you’ll find them. Improbable things happen a lot.
Summary
Thanks for reading!
To summarize a few of the common themes we saw above:
- more data is not always better,
- data and statistical models are limited,
- probability and statistics are about making decisions,
- statistics is hard and easy to get wrong,
- improbable things happen a lot.
Thanks for reading!
If you enjoyed this blog post, make sure to check out our free 77 data science lessons across 22 courses.